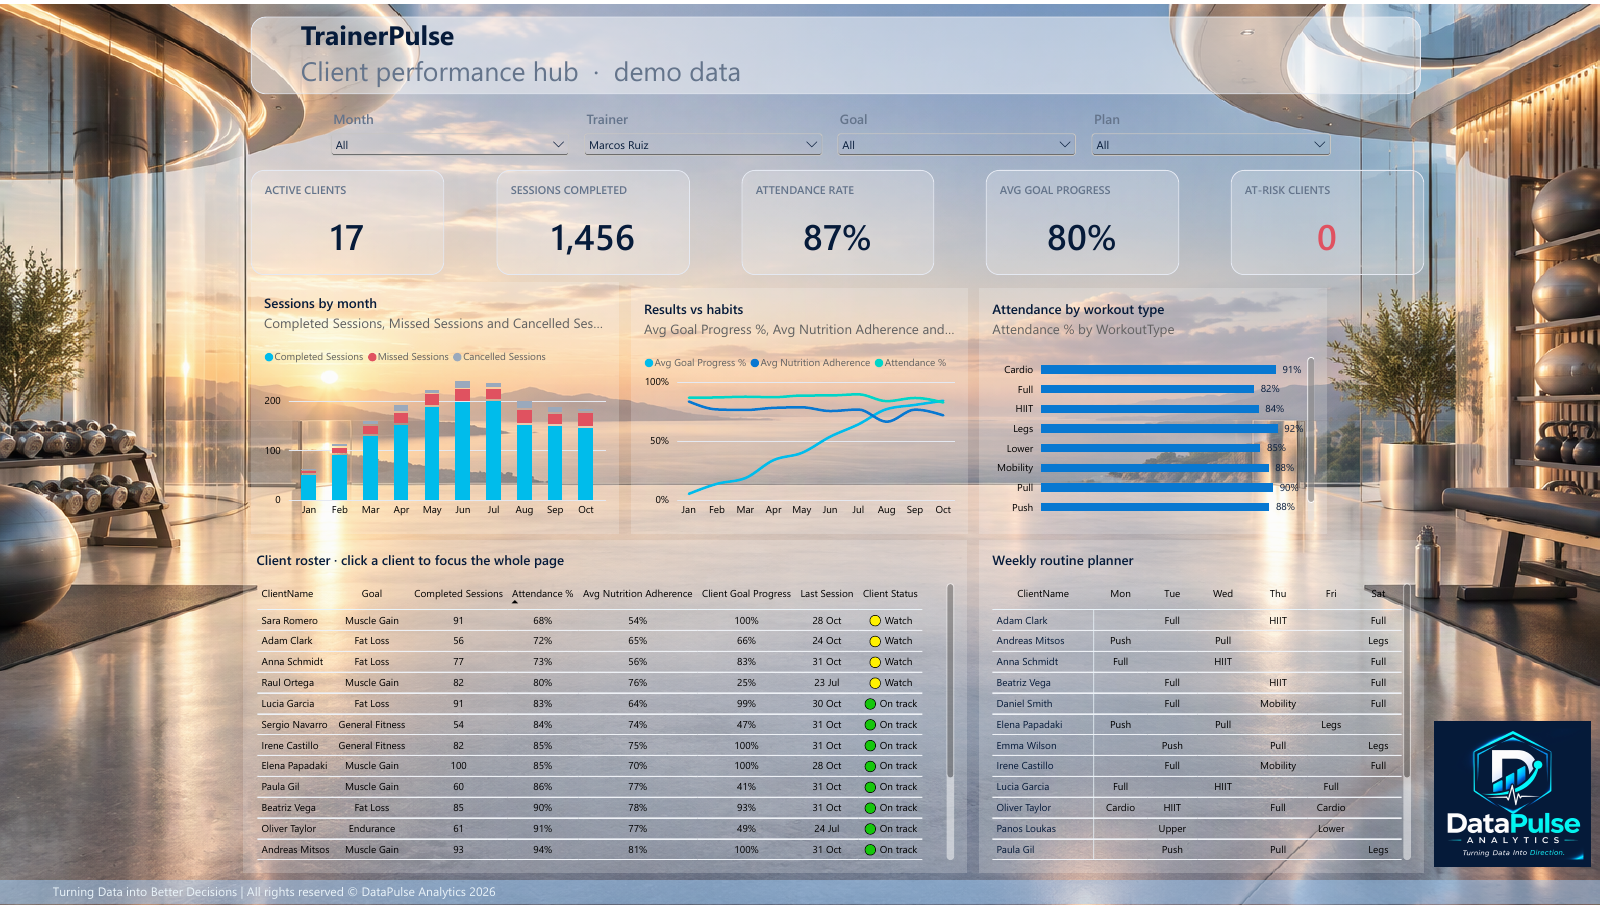
TRAINING & PERFORMANCE · DEMO
TrainerPulse
Monitor active clients, completed sessions, attendance, goal progress and workout patterns in one performance view.
BUSINESS INTELLIGENCE · PERFORMANCE ANALYTICS
We help ambitious businesses connect their data, define the right KPIs and build practical reporting that guides what to do next.
KPI strategy · Power BI · Performance controlling · Data automation
DATA IN ACTION
Explore a few examples of how dashboards turn complex information into a more useful picture of what is happening.
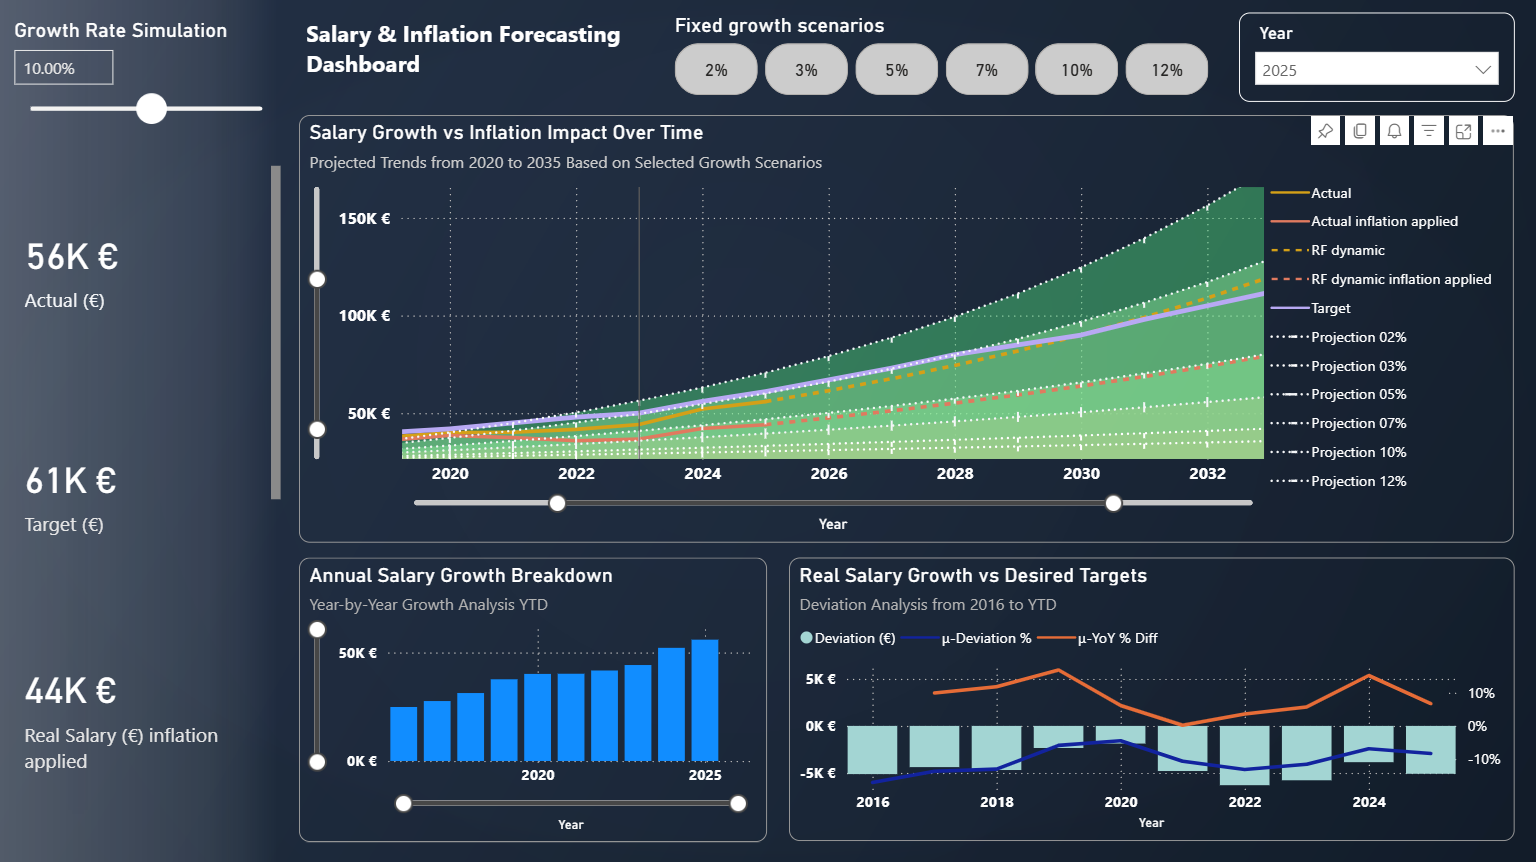
Dashboard previews are illustrative examples. Figures are shown as provided in the reports.
MORE DASHBOARD DEMOS
A closer look at four demo dashboards, each built around a different set of operational questions.
TRAINING & PERFORMANCE · DEMO
Monitor active clients, completed sessions, attendance, goal progress and workout patterns in one performance view.
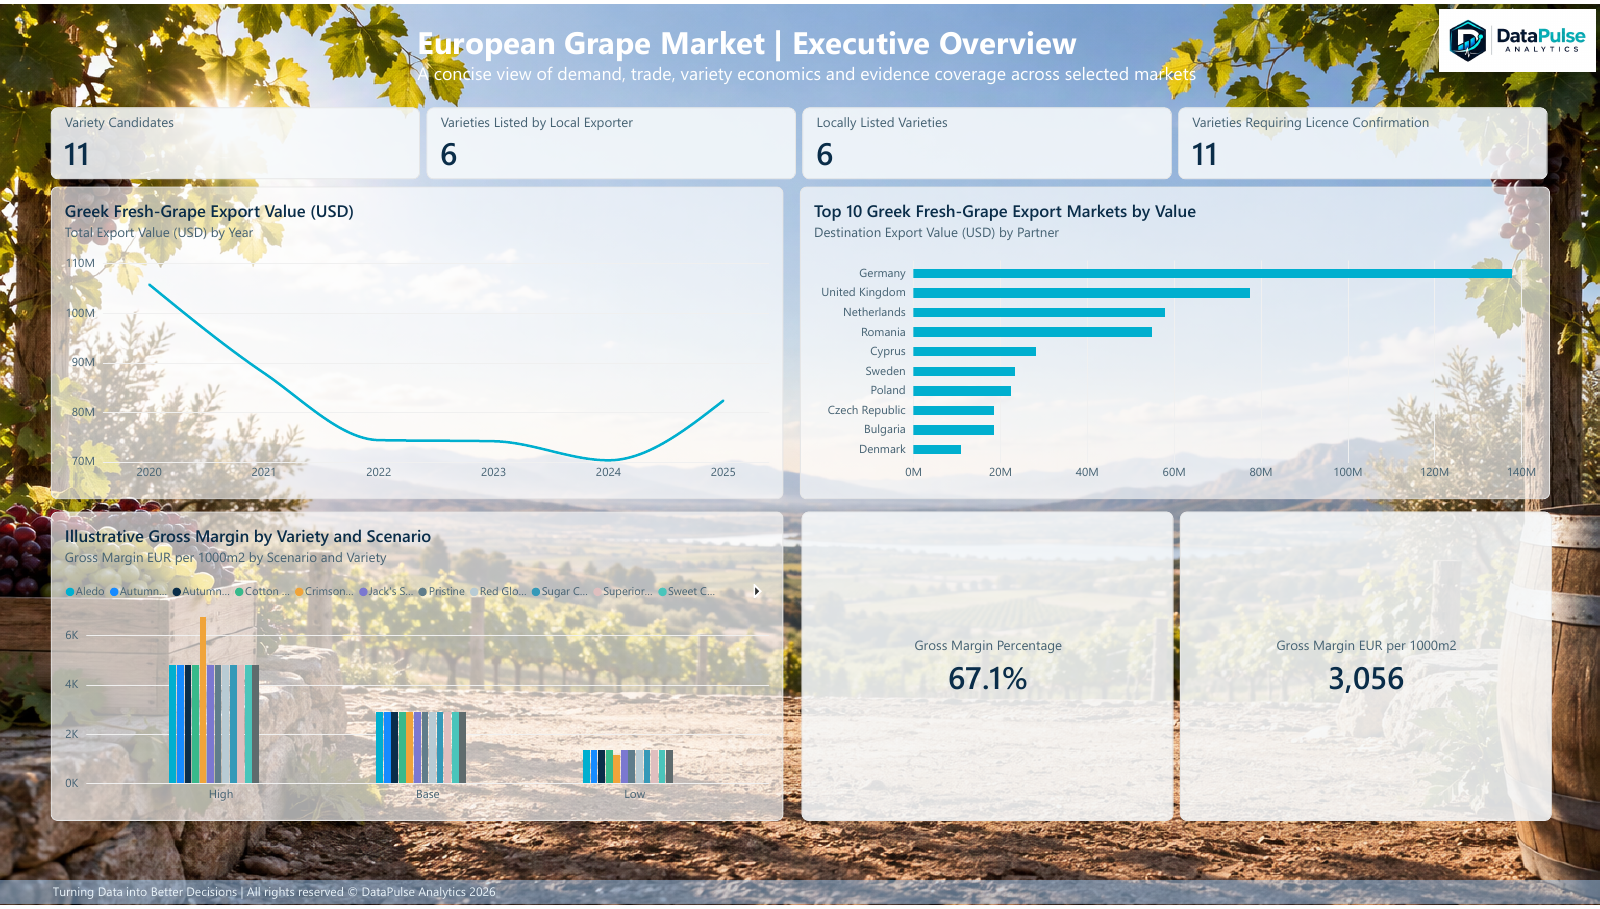
AGRICULTURE · DEMO
Explore export value by year and destination, variety comparisons and illustrative gross-margin scenarios.
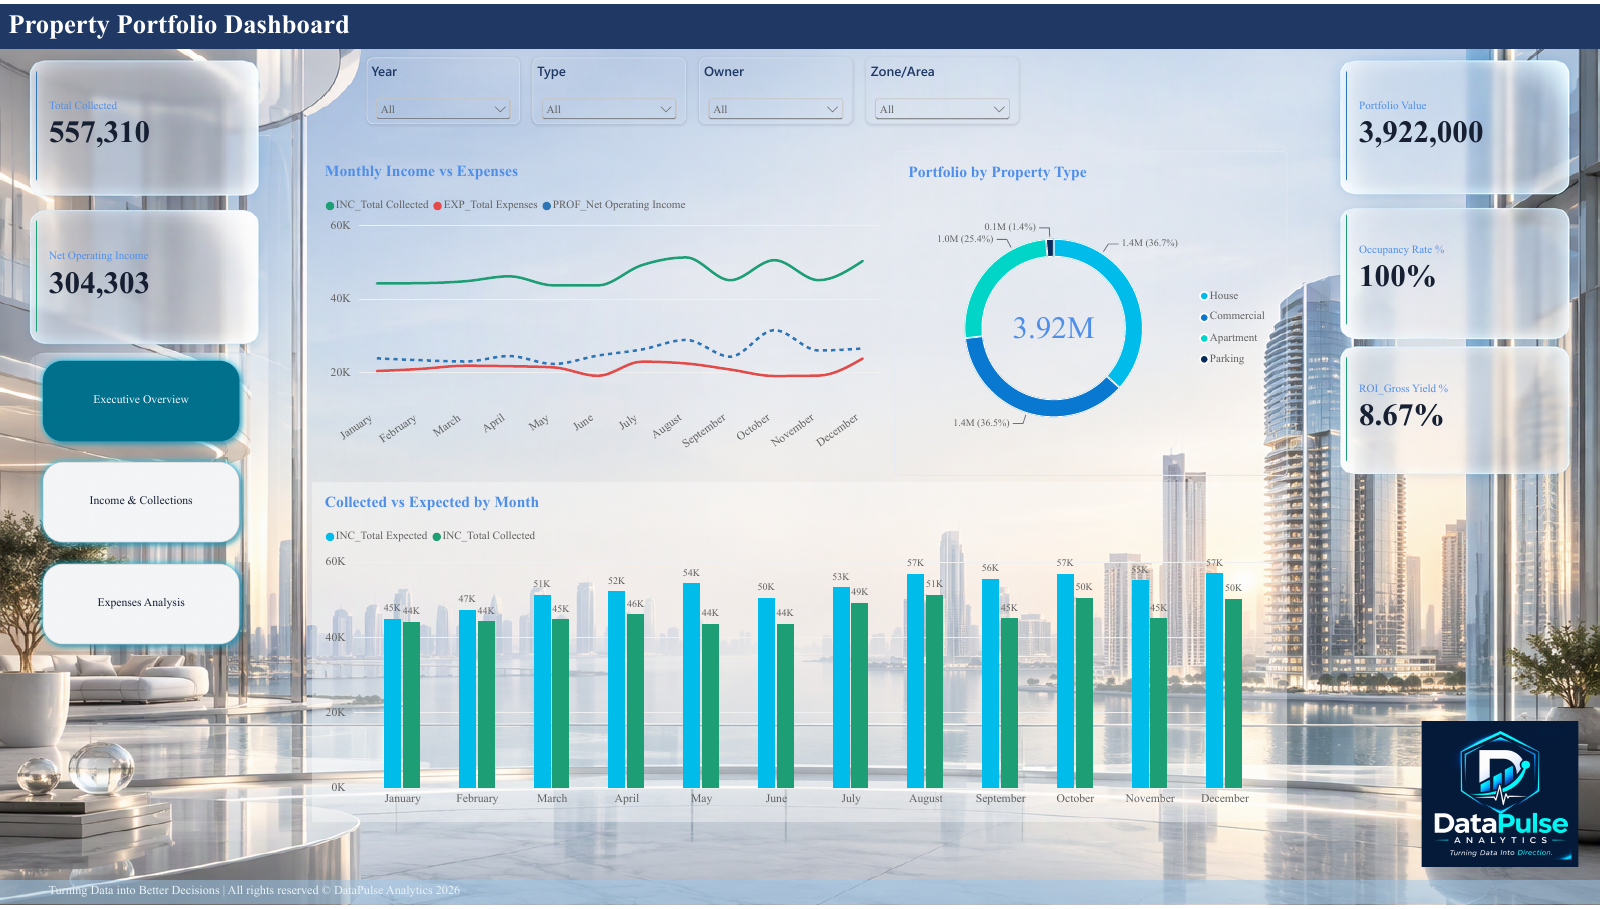
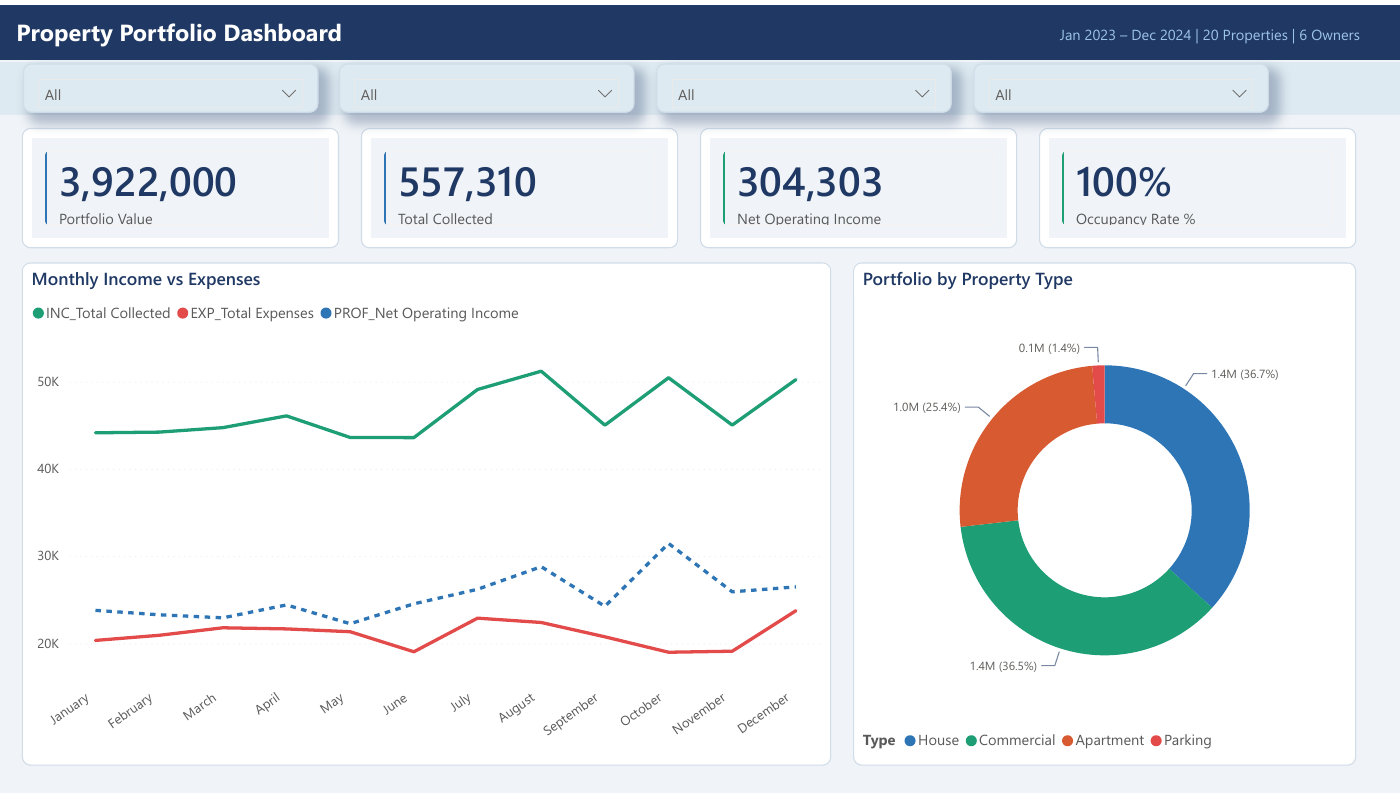
PROPERTY · DEMO
Bring portfolio value, monthly income and expenses, property mix and occupancy into a single management view.
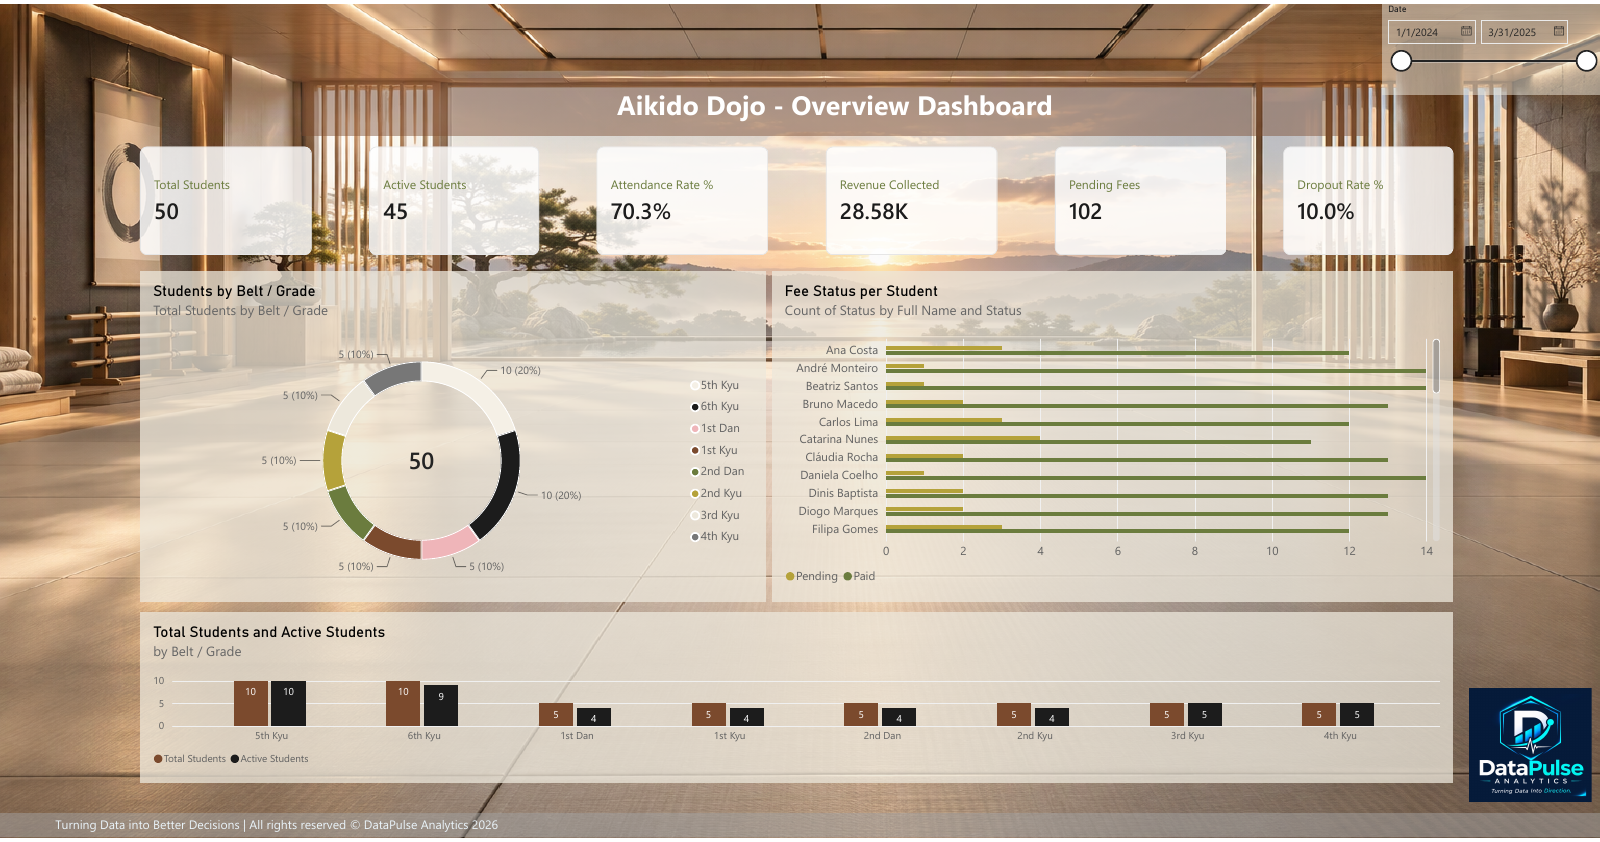
DOJO OPERATIONS · DEMO
Track student membership, attendance, collected and pending fees, and participation across belt or grade levels.
All report previews use demo data.
ILLUSTRATIVE DASHBOARD USE CASES
A few examples of the business questions a well-designed dashboard can bring into focus.
Compare export value, volume and unit value across destinations and years.
Bring property value, income and occupancy into one management view.
Explore opportunity volume, revenue trends and regional sales patterns.
Illustrative examples based on demo reports; these are not client testimonials.
WHAT WE DO
From scattered spreadsheets to a trusted management view, we build the structure and tools that help teams understand performance and act with confidence.
Connect data sources and turn reporting into clear, decision-ready dashboards with Power BI.
Power BI consulting →Choose meaningful measures, set targets and build a practical rhythm for performance reviews.
KPI management →Bring projects, resources, costs and delivery into one reliable view of operational performance.
Resource controlling →BUILT AROUND YOUR BUSINESS
We work with SMEs and teams across engineering, manufacturing, agriculture and professional services, shaping the analysis around your goals, data and operating reality.
Explore the industries we support →CLIENT EXPERIENCES
★★★★★ 4.9/5 overall · 3 client ratings
★★★★★ 5.0/5
“For ten years, I couldn’t get a clear picture of what was happening with my grapes. After one day of analysis, the situation finally came into focus.”
★★★★★ 4.8/5
“We significantly reduced our costs, and I no longer feel the same stress about managing the property.”
★★★★★ 5.0/5
“We already had the data. Seeing it presented in a clearer, simpler way gave us new insights and opened up opportunities we hadn’t seen before.”
START WITH A CONVERSATION
Tell us about the reports you use today and the questions you need to answer. We’ll help you find a practical next step.
Contact DataPulse Analytics